Red Sea Attacks: Hidden Costs of Disrupted Shipping

Red Sea Attacks and Disrupted Global Shipping: The Hidden Cost of War
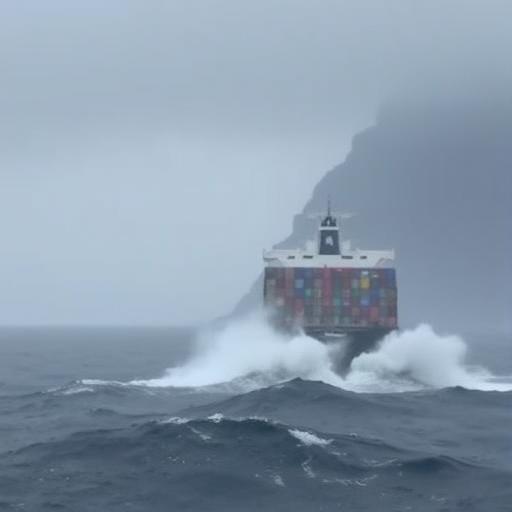
The Red Sea is once again at the center of global attention. A string of attacks on merchant vessels in and around the Bab el-Mandeb Strait has disrupted one of the world’s most vital maritime corridors, forcing container ships and tankers to divert thousands of nautical miles and adding days or weeks to transit times. The immediate headlines highlight missiles, drones, and hijack attempts. But the deeper story is the hidden cost of war that quietly flows through balance sheets, consumer prices, emissions ledgers, and geopolitical alignments.
This long-form guide explains why the Red Sea matters, how the attacks translate into global shipping disruption, and what the true costs look like for carriers, cargo owners, consumers, and governments. You will also find practical strategies to manage the risk, stabilize supply chains, and plan for different futures as the situation evolves.
Why the Red Sea Matters: Geography, Choke Points, and Trade Flows
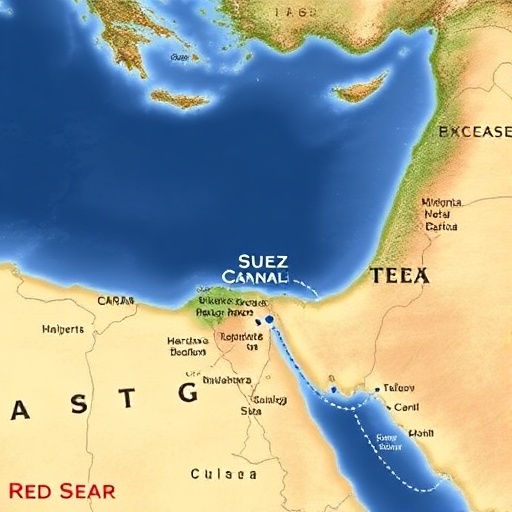
Maritime trade is the circulatory system of the global economy, and the Red Sea is one of its narrow arteries. The Suez Canal links the Mediterranean to the Red Sea, allowing Asia-Europe routes to bypass the long journey around the southern tip of Africa. At the southern end of the Red Sea, the Bab el-Mandeb Strait narrows to a critical choke point, funneling ships between Yemen, Djibouti, and Eritrea.
- Suez Canal: A man-made shortcut that carries a large share of east-west containerized trade and a significant portion of refined products and LNG flows. In normal times, using Suez can save more than a week compared with rounding the Cape of Good Hope.
- Bab el-Mandeb: A narrow strait vulnerable to asymmetric threats, including missiles, drones, and small boat attacks. Its geography amplifies risk because ships have limited room to maneuver.
- Global stakes: The corridor serves trade between Asia and Europe, the Middle East and Europe, and parts of East Africa. When risk rises, shippers face tough choices between speed, cost, and safety.
In stable periods, carriers plan networks, vessel rotations, and fuel consumption models around the speed and predictability of Suez. When that predictability disappears, so do the assumptions underpinning ocean freight pricing, capacity allocation, and downstream logistics.
How the Red Sea Attacks Unfolded
Tensions escalated as Yemen-based militants targeted merchant shipping with drones, anti-ship missiles, and occasional hijack attempts. Some vessels were struck or boarded, others narrowly avoided attacks, and many operators paused transits or rerouted fleets. While naval coalitions increased patrols and interceptions, their presence reduced but did not eliminate risk. The result was a persistent environment of uncertainty, fluctuating threat levels, and sporadic closures of risk corridors for certain carriers and routes.
The pattern has been uneven. Some ship types and flags continued limited transits, often under heightened alerts or in convoy, while many container lines adopted a default diversion via the Cape of Good Hope. Tankers and bulkers made case-by-case decisions based on cargo, charter terms, flag, and insurance conditions. The net effect has been a structural reduction in available capacity on Asia-Europe and related lanes, even without a formal closure of the Suez Canal.
From Attacks to Disruption: The Mechanics
Supply chain disruption is not just about a blocked lane. It is a cascade of operational choices and constraints that ripple across the network. The Red Sea crisis has triggered several reinforcing feedback loops:
- Rerouting via the Cape of Good Hope: Diverting around Africa adds thousands of nautical miles to Asia-Europe voyages, typically extending transit times by 9 to 14 days depending on speed and weather.
- Higher fuel burn: Longer distances and speed adjustments translate into significant additional bunker consumption, often hundreds to more than a thousand tons per voyage.
- Schedule upheaval: Extended voyages disrupt fixed-day weekly services, force blank sailings, and create bunching at destination ports.
- Equipment imbalances: Containers and chassis get stranded in the wrong places, driving up repositioning costs.
- Crew and safety burdens: Longer rotations, elevated fatigue risk, and tighter safety protocols increase staffing and welfare costs.
- Insurance escalation: War-risk premiums rise sharply for transits through designated high-risk areas, and some underwriters restrict coverage or add deductibles.
The Hidden Cost of War in Shipping: A Full Ledger
Public attention gravitates to headline freight rates, but the true cost picture is broader. Think of three layers: direct voyage costs, indirect business costs, and system-level costs that show up in macro indicators and environmental metrics.
Direct Voyage Costs
- Fuel: Additional days at sea translate into extra bunker consumption. With very low sulfur fuel oil prices often in the mid-hundreds of dollars per ton, a long diversion can cost hundreds of thousands to well over a million dollars in extra fuel alone.
- Charter hire: Time-chartered vessels accrue extra hire on longer voyages. Spot charters price in risk premia and opportunity costs, pushing up the daily rate.
- War-risk insurance: Transiting designated high-risk areas adds special premiums. During peaks, war-risk levies climbed from negligible amounts to material line items per voyage.
- Security measures: Armed guards, citadels, reinforced watchstanding, and additional equipment increase costs.
- Canal and port fees: Rerouting may avoid Suez tolls but add port calls for bunkering or crew changes, along with pilotage and port charges.
- Maintenance and wear: Longer voyages and heavy weather around the southern ocean increase hull and machinery wear, raising long-run maintenance costs.
Indirect Business Costs
- Inventory carrying costs: More days in transit means more capital tied up on the water. For high-value goods, the opportunity cost accumulates quickly.
- Forecasting errors: Longer and less predictable lead times degrade demand planning, causing overstock in some nodes and stockouts in others.
- Lost sales and markdowns: Seasonal goods miss windows, forcing discounting. Promotional calendars slip, eroding margins.
- Production interruptions: Just-in-time manufacturing faces line stoppages when critical components are delayed.
- Contract penalties: Failure to meet delivery milestones triggers penalties under supply agreements and project contracts.
System-Level Costs
- Inflationary pressure: Elevated shipping and insurance costs filter into consumer prices with a lag, especially for bulky or low-margin products.
- Trade route reshaping: Structural rerouting reduces effective capacity and increases variability, with knock-on effects for port infrastructure investment and labor needs.
- Fiscal strain on transit states: Reduced Suez Canal transits cut fee revenues for Egypt, with implications for regional economies.
- Environmental externalities: Longer voyages increase emissions, complicating decarbonization trajectories and compliance with emerging carbon pricing regimes.
A Practical Cost Example: Asia to Europe, With and Without Suez
Consider a mainstream Asia to North Europe container service. A typical Suez routing can be roughly a couple of weeks shorter than a Cape diversion. Suppose a carrier diverts and adds about 10 to 12 days at sea.
- Fuel delta: Additional bunker burn over 10 to 12 days can easily run into the high hundreds of tons or more, depending on vessel size and speed. At mid-range bunker prices, that is frequently in the hundreds of thousands to more than a million dollars.
- Hire delta: Daily time-charter rates magnify across 10 to 12 extra days, adding another substantial six- or seven-figure sum.
- Insurance delta: War-risk premiums for a high-risk corridor can be material even for a single transit, though they vary widely by underwriter, flag, and ship particulars.
- Operational ripple: Port windows missed lead to congestion surcharges, extra tug and pilotage, and sometimes feeder rebooking.
Put together, the all-in incremental cost per diverted voyage can easily reach into the low millions of dollars. That burden is shared differently depending on contract structure, but the cost exists regardless of how it is allocated.
Who Pays The Bill: Shippers, Carriers, or Consumers
Ocean freight is a cost pass-through business over time. In the short run, when spot markets spike, shippers on long-term contracts enjoy a cushion while carriers absorb some of the pain. Conversely, when contracts renew, surcharges and higher base rates shift the burden to cargo owners. Ultimately, some portion reaches consumers in the form of higher shelf prices, though timing and magnitude vary by product, competition, and retailer strategy.
- Carriers recoup via emergency surcharges, peak season surcharges, and general rate increases, but face higher operating costs and network inefficiencies.
- Forwarders manage allocation and visibility, passing through surcharges while seeking premium capacity for urgent cargo.
- Shippers juggle budget overruns, buffer stock, and altered product flows to meet service levels.
- Consumers encounter slower deliveries and eventual price adjustments, often masked within broader inflation dynamics.
Sector-Specific Impacts
Retail and Electronics
Fast-moving consumer goods and electronics depend on synchronized product launches, holiday windows, and promotion cycles. A two-week delay pushes inventory into the wrong season and forces markdowns. Lightweight, high-value SKUs may shift to airfreight selectively, but capacity and cost constraints limit this safety valve.
Automotive and Industrial Components
Automakers run finely tuned just-in-time operations. A few delayed wiring harnesses or chips can halt an entire assembly line. Diversified sourcing and nearshoring help, but tier-2 and tier-3 suppliers remain globally dispersed. Buffer stocks reduce stoppage risk but increase capital costs.
Energy, Chemicals, and Bulk Commodities
Crude and product flows adjust based on voyage economics, refinery margins, and regional demand. Longer routes change arbitrage calculations and can temporarily widen or narrow regional price spreads. Chemical producers face vessel availability issues, specialized tank capacity constraints, and hazardous cargo insurance hurdles.
Food and Agriculture
Perishable supply chains have limited tolerance for delays. Cold-chain costs rise with longer transit, and quality risks increase. Dry bulk grains may reallocate export origins to minimize exposure, while edible oils and refrigerated proteins adjust shipping programs to align with vessel reliability.
Humanitarian Cargo and Essential Goods
Aid shipments, medical supplies, and staple foods depend on predictable transit into vulnerable regions. Delays and cost inflation reduce volumes delivered under fixed budgets, exacerbating humanitarian challenges.
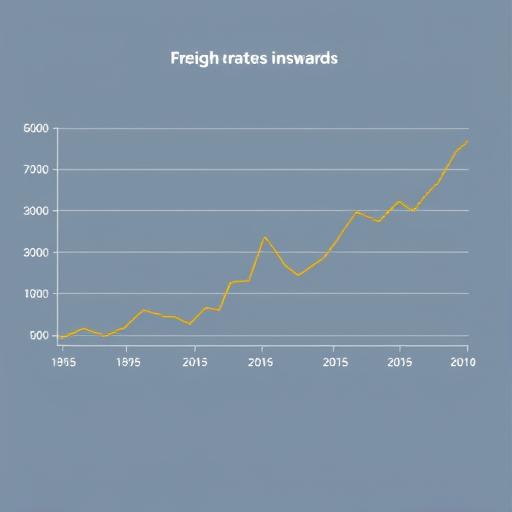
Market Signals: What The Indices Are Saying
Disruptions show up in a handful of visible indicators:
- Spot container rates: Asia-Europe and Mediterranean lanes experienced sharp spikes during escalation phases as capacity tightened and carriers prioritized reliability on diverted loops.
- Time-charter rates: Charter hire moved up for certain vessel classes as operators needed more ships to maintain weekly services on lengthened routes.
- Schedule reliability: On-time performance dropped, and average delays extended, particularly on headhaul legs into Europe.
- Suez transits: Canal transits declined relative to baseline periods, reducing revenue for canal authorities and signaling sustained rerouting.
Winners and Losers
- Potential winners: Owners with modern, fuel-efficient fleets can capture higher rates and margins, especially if they hedged fuel. Bunkering hubs on diversion routes and ports positioned for emergency calls see higher throughput. Rail, air, and intermodal providers benefit from modal shifts.
- Potential losers: Energy-importing regions that rely on short transit times face higher costs. Exporters tied to tight delivery windows or low margins struggle to absorb surcharges. Canal-dependent economies lose fee income during prolonged diversions.
The Environmental Toll: Emissions and Compliance
Longer voyages mean more fuel burned and higher emissions. Even with slow steaming, a diversion that adds thousands of nautical miles can increase voyage-level CO2 by double-digit percentages. That undermines corporate climate targets and complicates compliance with emissions reporting and emerging carbon costs.
- Scope 3 squeeze: Cargo owners tracking supply chain emissions see shipment-level footprints rise, creating pressure to offset or reduce elsewhere.
- Regulatory alignment: As carbon regulations tighten, the cost of longer routes includes not only fuel but also potential carbon charges or allowances.
- Design vs. operation: Newer ships with better design efficiency help, but operational realities on detours still dominate emissions math in the short term.

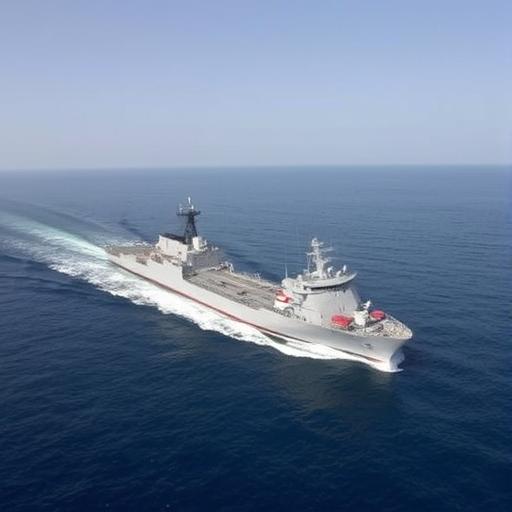
Naval Escorts, Convoys, and Risk Management at Sea
Naval coalitions launched patrols and protection missions to safeguard commercial shipping. Escorts, surveillance assets, and missile defenses reduced but did not eliminate risk. Participation varies by flag, cargo type, and operator policy. Some ships opt for convoys, others for independent routing with enhanced onboard security and real-time intelligence feeds. The result is a patchwork of mitigations rather than a uniform solution.
For many operators, risk acceptance depends on contract terms, cargo criticality, and insurance conditions. Some fleets resume selective Suez transits when threat levels and coverage align; others maintain Cape diversions as their base case. This variability keeps the network fragmented and complicates planning for port authorities, inland carriers, and shippers.
Corporate Playbook: How to Navigate Red Sea Disruption
Companies cannot control geopolitics, but they can control preparedness. A practical playbook blends network design, financial hedging, and tactical execution.
- Dual-route planning: Build schedules that explicitly model both Suez and Cape options with triggers to switch based on risk and rate differentials.
- Portfolio sourcing: Diversify suppliers and nearshore critical components where feasible to reduce exposure to long east-west routes.
- Buffer inventory with intelligence: Use risk-adjusted inventory targets tied to real-time lead-time variability rather than static safety stock rules.
- Contract flexibility: Mix long-term contracts with indexed clauses and spot market agility. Negotiate surcharge transparency and caps where possible.
- Modal agility: Prearrange contingency capacity on airfreight and rail for high-value or time-sensitive SKUs.
- Insurance optimization: Review war-risk coverage, deductibles, and trading warranties. Coordinate with carriers and brokers to avoid gaps.
- Visibility and exceptions: Invest in shipment visibility, predictive ETAs, and control towers to trigger exception management earlier.
- Financial hedges: Consider bunker fuel hedging and currency hedges to stabilize voyage costs.
- ESG integration: Track emissions impacts of rerouting and compensate via efficiency projects or credits to stay on climate trajectories.
Scenarios: The Next 12 to 24 Months
Strategic planning improves when leaders prepare for multiple plausible futures. Consider three broad scenarios:
- Stabilization: Naval presence and regional de-escalation reduce attack frequency. Selective Suez transits expand, rates normalize, and schedule reliability climbs. Some diversions remain for specific risk profiles.
- Prolonged friction: Threat levels ebb and flow. Carriers maintain a hybrid network with periodic surcharges and variable schedules. Capacity remains tighter than pre-crisis norms.
- Severe escalation: Attacks intensify or spread, prompting widespread avoidance of the corridor. Extended diversions become the default, and global freight markets reprice for a longer-term shock.
Each scenario carries distinct cost, capacity, and emissions implications. Companies should assign triggers and decision rules to pivot between them.
KPIs and Early Warning Signals to Watch
- Asia-Europe spot and contract rates: Leading indicator of capacity tightness.
- Schedule reliability and average delay: Operational health of services.
- Canal transit counts: Real-time proxy for carrier risk tolerance.
- Bunker price spreads: Cost differential between major bunkering hubs and the impact of longer voyages.
- War-risk insurance levels: Market sentiment on security risk.
- Port congestion indices: Arrival bunching after diversions.
- Container equipment balance: Availability of empties in export hubs.
Beyond Shipping: Macroeconomic and Social Dimensions
The hidden cost of war extends beyond freight invoices. Inflationary impulses ripple into consumer baskets, particularly for goods with high logistics cost shares. Governments adjust budgets as canal revenues fluctuate and defense outlays rise. Regions dependent on predictable import flows for fuel and food navigate tighter markets and higher prices. Meanwhile, workers face longer rotations, and coastal communities experience both the strain and opportunity of shifting trade patterns.
Financial markets price in uncertainty. Equity investors reward carriers during rate spikes but discount long-term volatility. Commodity markets watch for distortions in crude, refined products, and LNG flows as voyage lengths alter supply timing. Credit markets reassess risks for exposed economies and companies with fragile liquidity positions amid rising working capital needs.
Technology and Data: Turning Turbulence Into Insight
Modern logistics depends on visibility and analytics. Satellite AIS, weather routing, predictive ETA models, and risk intelligence platforms enable better choices in volatile conditions. Digitally linking purchase orders to shipments and inventory status shortens the feedback loop from disruption to action.
- Dynamic routing: Algorithms that factor risk zones, fuel prices, weather, and port congestion help optimize detours.
- Digital twins: Simulating supply networks under different Red Sea scenarios quantifies cost, service, and emissions trade-offs.
- Exception automation: Automated rebooking and reprioritization reduce manual firefighting and customer churn.
Policy Choices: Security, Trade, and Climate Goals
Governments and international bodies face trade-offs. Securing sea lanes requires sustained naval resources and diplomatic coordination. Trade facilitation measures, such as streamlining port clearance and enabling flexible customs processes during emergencies, can mitigate some delays. Climate ambitions must contend with temporary setbacks in emissions due to diversions, suggesting the need for targeted efficiency programs and alternative fuels to keep long-term goals on track.
Frequently Asked Questions
Is the Suez Canal closed
No. The canal has remained operational, but many carriers chose to avoid the Red Sea corridor during heightened risk, leading to fewer transits and more diversions around Africa.
Are all ships affected equally
No. Risk assessments vary by vessel type, flag, cargo, and insurer stance. Some tankers and bulkers continue selective transits, while many container services adopted Cape diversions as standard during elevated threat periods.
How much longer is the Cape diversion
Rerouting around the Cape of Good Hope typically adds thousands of nautical miles and roughly 9 to 14 days depending on speed and weather. The exact delta varies by origin, destination, and operational parameters.
Will consumers see higher prices
Likely yes, though with a lag and unevenly across categories. Products with high freight-cost shares or tight launch windows show price impacts earlier.
What can shippers do now
Enhance visibility, diversify suppliers, secure flexible contracts, model dual routes, arrange contingency air or rail capacity for high-value SKUs, and align insurance coverage with evolving risks.
Is airfreight a viable substitute
For critical, lightweight, high-value goods, airfreight can bridge gaps, but costs are far higher per unit weight and capacity is finite. It is a scalpel, not a cure-all.
How does this affect emissions targets
Longer voyages raise shipment-level emissions. Companies should account for the increase, invest in efficiency and alternative fuels where possible, and consider offsets to stay aligned with climate commitments.
Case Study: Building Resilience Without Breaking the Bank
A mid-sized European retailer importing apparel from multiple Asian origins adopted a dual-route policy: a portion of weekly volumes was contracted on services that could switch between Suez and Cape with pre-agreed surcharges and schedule leeway. The company increased safety stock for fast movers by a modest factor tied to real-time lead-time variance and reserved limited airfreight for promotional items. Visibility tools flagged late-breaking delays, triggering reprioritization of DC allocations. The net effect was a manageable service dip without runaway costs, even as market rates surged.
Action Checklist for Supply Chain Leaders
- Map exposure to Red Sea corridors across SKUs, suppliers, and lanes.
- Quantify cost-to-serve under Suez and Cape scenarios, including emissions.
- Set dynamic safety-stock targets using lead-time variability, not averages.
- Negotiate surcharge transparency and escalation triggers in ocean contracts.
- Pre-book contingency capacity on air and rail for priority SKUs.
- Align insurance coverage and document trading warranties with carriers.
- Deploy predictive ETAs and exception workflows to cut reaction time.
- Run quarterly scenario war games with finance, sales, and operations.
- Publish an internal playbook so teams act fast when threat levels shift.
Conclusion: Counting the Real Costs and Preparing for What Comes Next
The Red Sea attacks have exposed how tightly wound the machinery of global trade has become. When a narrow corridor turns risky, what looks like a local security issue quickly becomes a worldwide logistics and pricing problem. The hidden cost of war is not just the headline freight rate or a temporary surcharge. It includes delayed production, lost sales, elevated emissions, strained crews, and reshaped trade patterns that can endure long after the shooting stops.
For leaders across shipping, manufacturing, retail, and policy, the task is twofold. First, manage the immediate disruption with pragmatic tools: dual-route planning, flexible contracts, visibility, and targeted buffers. Second, design for resilience by diversifying supply, embedding scenario planning, and aligning security, trade, and climate goals. The storm may pass, but the lessons should endure. The companies that internalize them will navigate not only the Red Sea crisis but the next inevitable shock to the global supply chain.